School discipline in New Bedford- are there racial and ethnic disparities?
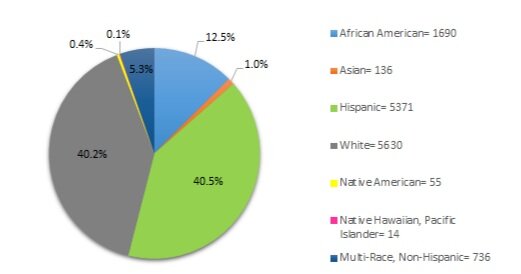
2017-2018 New Bedford’s Public School population: by race
Total = 13,632 students
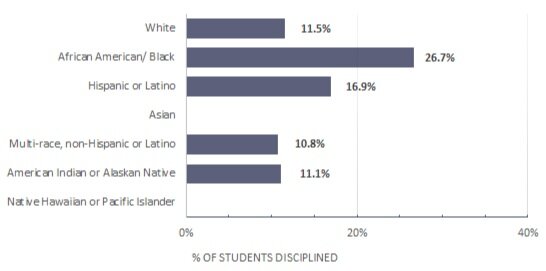
*The following set of graphs describes what percentage of each enrolled subgroup was disciplined at least once. For example, the graph below reads as 11.5% of white, 26.7% of Black, 16.9% of Latinx, 10.8% of Multi-Race and 11.1% of American Indian students with a disability in New Bedford were disciplined in the 2017-2018 academic year.
school Discipline rates: students with a disability
School DISCIPLINE RATES: STUDENTS WITHout A DISABILITY

School DISCIPLINE RATES: students who are
ECONOMICALLY DISADVANTAGED

school discipline rates: students who are not
Economically disadvantaged

*Please note that this data does not include charter schools in New Bedford.
Discipline percentages are derived from unduplicated counts (that is, students who were disciplined multiple times are only counted once).
Source: Massachusetts Department of Elementary and Secondary Education